Business Intelligence
Data Analytics & Visualization
Transform raw data into actionable insights using Python, R, and Power BI.
Transform raw data into actionable insights using Python, R, and Power BI.
VGT is the oldest centre of Kota city for Python and Data Analytics. We provide high-quality and friendly study material with an emphasis on a practical approach.
Bar, Histogram, Pie, Scatter, 3D Plotting.
Heatmaps, Regression Plots, KDE, Facet Grid.
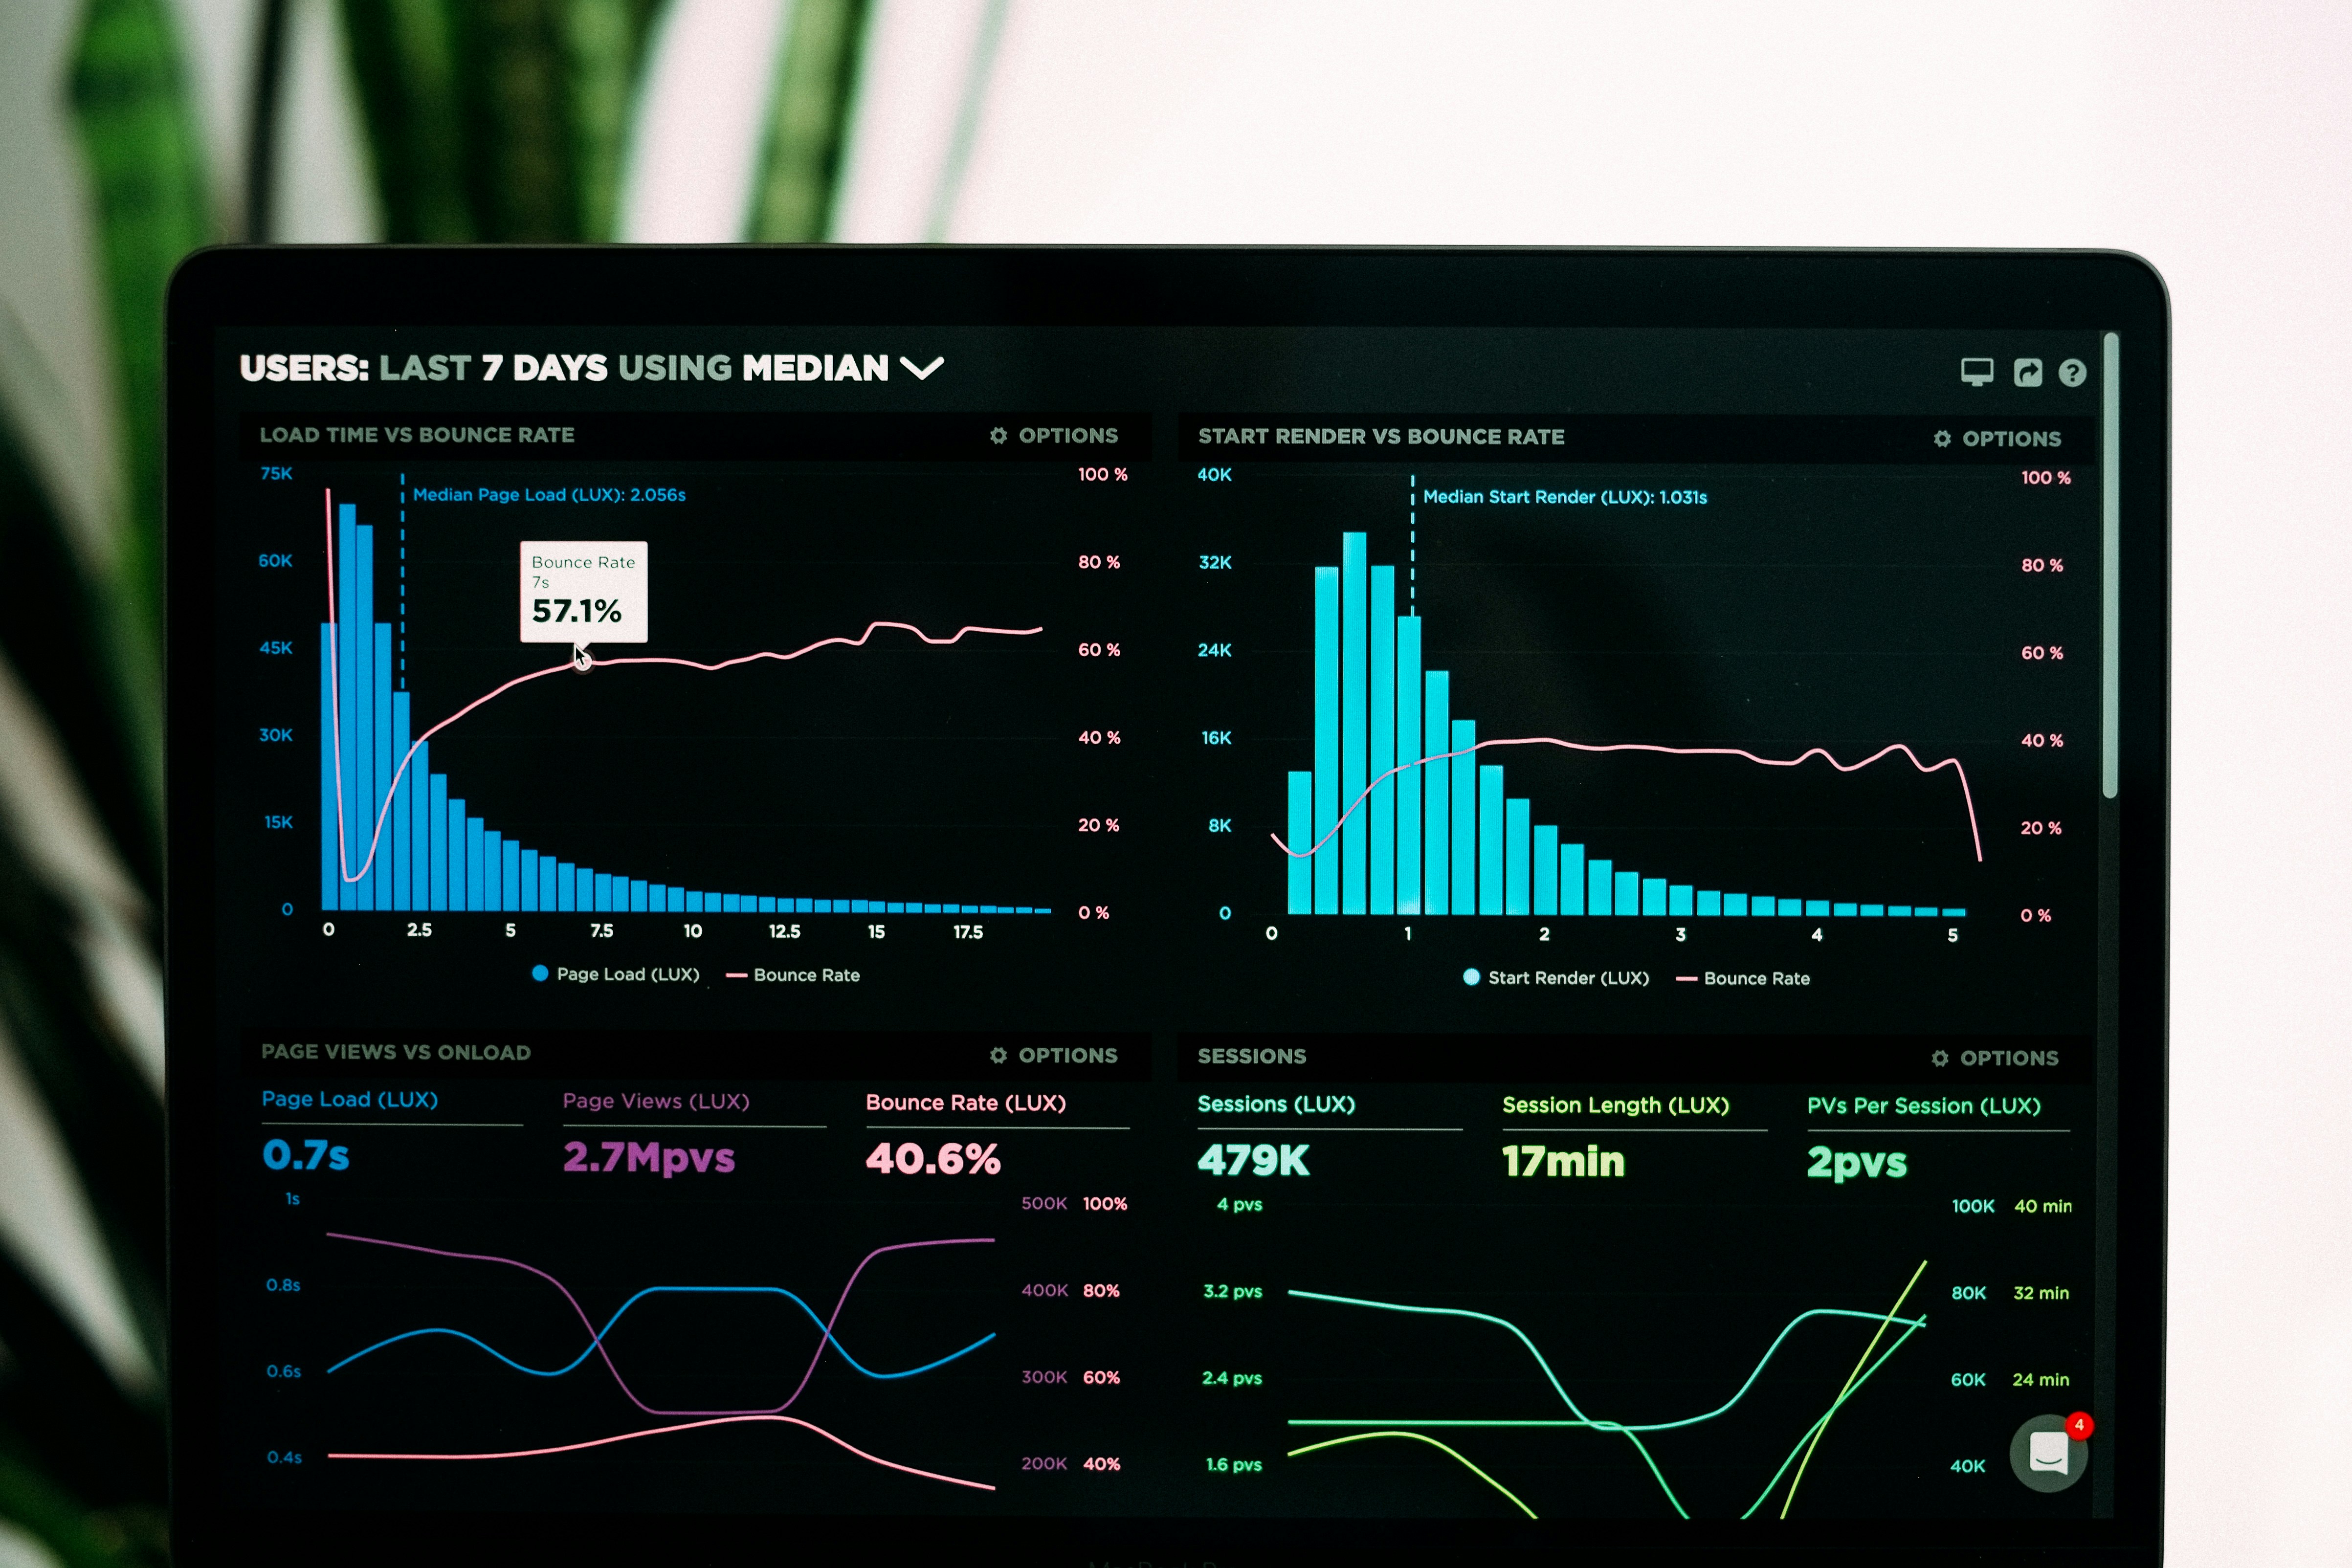
Data Visualization, Dashboard Creation, Data Transformation.
Interactive Dashboards, Visual Analytics.